3.2 KiB
| title | visible |
|---|---|
| Hosted Grafana | true |
Details of the burble.dn42 hosted Grafana service.
===
Hosted Grafana Service
| Host / URL | Service |
|---|---|
| http://grafana.burble.dn42/ | Grafana Dashboards (dn42 link) |
| https://grafana.burble.com/ | Grafana Dashboards (public internet link) |
| influx.burble.dn42:8086 | InfluxDB Endpoint |
The hosted grafana service provides an InfluxDB and
Grafana combination for storing and displaying stats and metrics.
The service can accept metrics from any source that is able to
publish to the InfluxDB, including
Prometheus and
Telegraf.
To apply for an account, contact dn42@burble.com.
Accounts are provided with a dedicated database and Grafana organisation allowing users to create and manage their own graphs and dashboards as required. The Influx database will store up to 1 year of data with a minimum interval of 1 minute.
The grafana service is hosted on dn42-fr-rbx1.burble.dn42. Service users are encouraged to peer directly with the service node in order to lower latencies and avoid sending large amounts of data through other nodes in DN42.
DN42 Infrastructure Monitoring
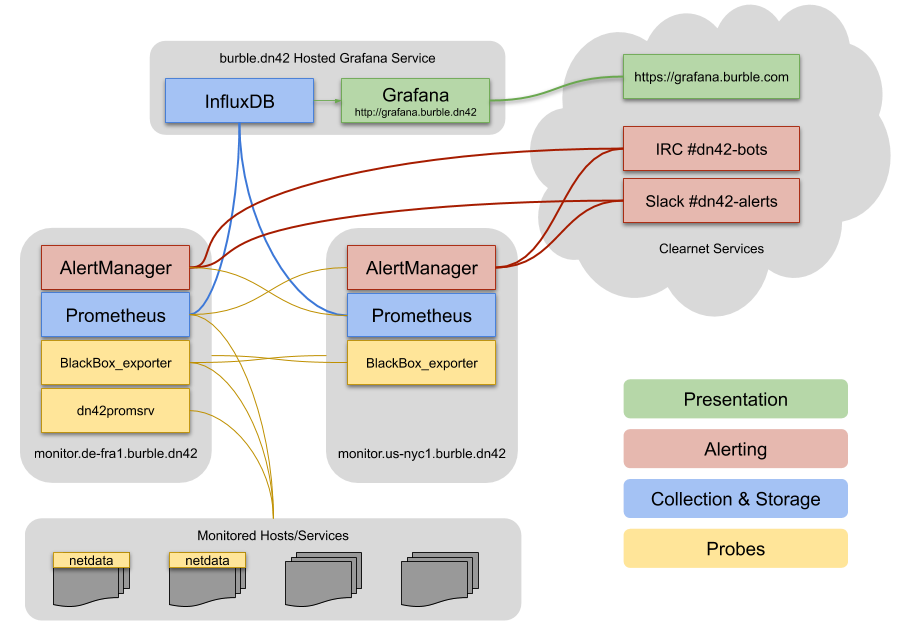
The burble.dn42 network hosts monitoring and alerting of key DN42 infrastructure.
The monitoring service logs metrics to the hosted grafana service, and presents alerts to
the #dn42-bots channel and slack. Two monitoring nodes hosted in separate regions ensure that
alerts will be generated if the main monitoring node fails.
The monitoring architecture is detailed below:
Nodes
The main monitoring node is hosted on dn42-de-fra1, with a secondary backup node on dn42-us-nyc1.
Both nodes monitor the availability of services on each other and are capable of alerting if the
peer node is unavailable.
Presentation
Metrics collected by the service are presented as public graphs in the burble.dn42 grafana service (see above).
Alerting
AlertManager is configured as a cluster, operating across both monitoring nodes.
Alerts are published in real time to the #dn42-bots hackint IRC channel (using
alertmanager-irc-relay and
burble.dn42/dn42-alerts channel in slack.
Alerts typically fire when a problem occurs for 5 minutes or longer.
Collection and Storage
Prometheus is used to collect metrics from the various probes and publish them to the hosted Influx
database.
Typically metrics are collected every minute, although this is reduced to every five minutes
for the clearnet DN42 services to avoid excessive load.
The main node for data collection is monitor.de-fra1.burble.dn42
Probes
| blackbox_exporter | Used to ping hosts or query services (e.g. HTTP/s probes) |
| netdata | Used to collect many host system metrics |
| dn42promsrv | Custom collector for DN42 specific probes |
